Decoding Images from Space
Using an SDR dongle to listen to weather images from NOAA satellites.
NOAA, the American National Oceanic and Atmospheric Administration, operates satellites to monitor Earth. The geostationary ones have an orbital period that is equal to the Earth’s rotational period, seen from the ground they appear motionless. Geostationary satellites orbit Earth at 35,786 kilometers and are often used for communication. NOAA’s polar satellites follow a heliosynchronous orbit, more useful for imaging, because every time that the satellite is overhead, the surface illumination angle on the ground will be the same. Polar satellites orbit Earth at ±800 kilometers and take pictures of the clouds underneath, used for weather forecasting. The cool thing is we can listen in and receive these photos ourselves!
NOAA-15, 18, and 19
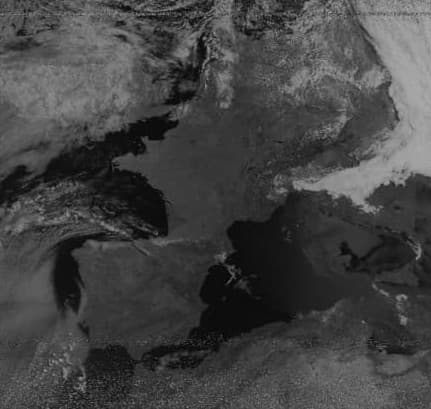
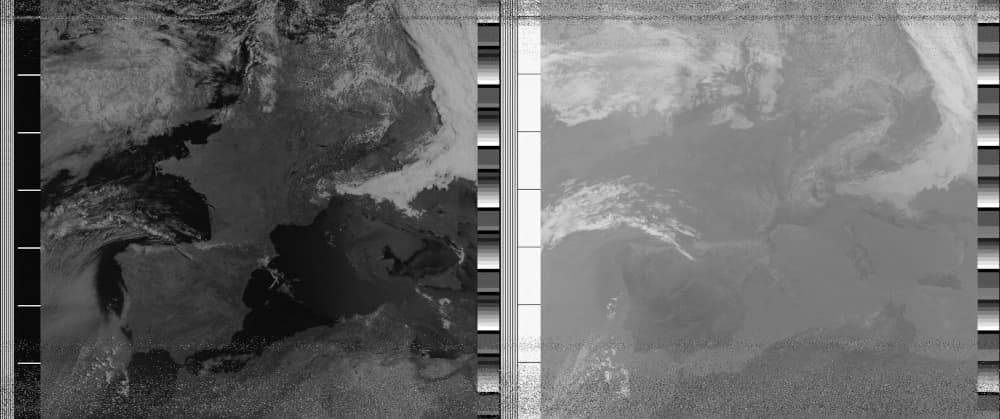
Three polar satellites are currently operational: NOAA-15, NOAA-18, and NOAA-19. TRIOS-N satellites, weighting around 1.5 ton, using 830 watts of power. Given they orbit Earth in a little over 100 minutes there is a good chance you can capture them multiple times per day. The weather images have a 4 km per pixel resolution and are sent back to Earth via an analog transmission mode called Automatic Picture Transmission or APT. There are two images side by side: one in long-wave infrared and the other near-visible or mid-wave infrared depending whether it’s day or night on the ground. The APT transmission can be recorded as sound and converted to an image.
FM Radio
Radio equipment used to be expensive, but since software is eating the world we now have SDR! Radio components that traditionally have been implemented in hardware are now implemented in software. I have an RTL-SDR USB dongle which seems well supported and for under €30 it even came with an antenna.
We’ll also need some free and open-source software to tune the radio: gqrx (CubicSDR or SDR# are other options). The first time you start gqrx it’ll ask you to configure the I/O device: select the dongle from the dropdown and leave the other settings untouched. Choose “WFM” from the “Mode” dropdown in the “Receiver Options” section on the right. Click the play button (top left) and try to find one of your local FM radio stations to confirm everything is working. Drag the red line (frequency) and change the width of the grey box (filter width) in the top section to see how it behaves, we’ll need this later. The top section is called the panadapter, it shows what is currently being received. The bottom section is called the waterfall, it shows a log of what has been received. Enjoy your old-school radio on your high-tech computer. Try recording a bit as well (use the “Rec” button). If you need an extra challenge you can find the departure or approach frequencies for your local airport and listen to air traffic control.
Satellite Tracking
Back to our satellites. You can only listen to a satellite if you have line-of-sight. I use the paid StarWalk 2 iOS app to see when NOAA-15, 18, or 19 will appear on the horizon but there are free applications or websites you can use as well. The higher in the sky the better, a satellite that only skimps the horizon will be difficult to hear. Same for the antenna: the higher up the better. I stick mine on the window in the attic. When do you watch satellites? At night, of course, there is too much light during the day. Listening to weather satellites is better during the day since the photos at night tend to be a bit… dark. No wonder my first capture was disappointing.
My dongle came with a V-dipole antenna, aka a bunny ears antenna, aka the antenna from an old TV. It so happens to be a good antenna to listen to weather satellites. For optimal results, the antenna has to be horizontal (less interference from vertical broadcast sources), with the tip of the V pointing north (or south if you are in the southern hemisphere) with rods of 52 cm at a 120° angle (see this antenna guide).
Recording
Ready? Start gqrx and tune into the frequency for the satellite you are expecting (pro tip, add these as bookmarks in gqrx).
- NOAA-15
- 137.620 MHz
- NOAA-18
- 137.9125 MHz
- NOAA-19
- 137.1 MHz
These are the settings that work best for me but you might need to play around a bit, I am not a radio amateur.
Input Controls
- KNB LO
- I have no idea what this is for. Leave it at 0 MHz.
- Hardware AGC
- Automatic gain control, the tooltip mentions it is known to work with RTL-SDR devices so I turned it on. Haven’t tried without yet so not sure if it’s really needed.
- Freq. correction
- Keep the default 0.0 ppm, no idea what this does.
Leave the other options turned off.
Receiver Options
- Frequency bar (black bar at the top)
- Don’t worry about this one, we’ll do this manually by dragging the red line in the panadapter section.
- Frequency
- Same, we’ll use the panadapter.
- Filter width
- Change the width in the panadapter section. It’s the light gray box around the red line and you can change its width by grabbing the sides. The box should cover the width of the pattern you see in the waterfall section when the satellite is in range (around 40 k).
- Filter share
- Normal. I think it’s tuning how sharp the signal dorps of near the edges of the filter width. I didn’t see any changes between the different options so leave it as is.
- Mode: WFM (mono)
- APT signals are mono so no need listen to a stereo signal.
- AGC
- I have it on fast but, again, no idea what this does.
- Squelch
- The squelch “hides” the noise floor so you only hear the peaks and not the constant white noise. It potentially hides part of the transmission so turning it off is our best bet: clicking the “R”eset button will set it to its lowest value (-150 dB).
- Noise blanker
- Make sure these are turned off.
- FFT size and Rate
- Defines how many FFT points are calculated. I choose the maximum numbers from both lists, since less is more? I have no idea if this does something useful.
- Time span
- Auto
- Window
- Whatever you like.
- Averaging
- Around 75%, enough to hide the noise but not too much to hide the signal.
- Panadapter
- This changes the height of the panadapter and waterfall sections. Not sure why this is even an option since you can simply resize them with the mouse as well.
- Peak
- Leave both off.
- Pand. dB and Wf. dB
- Use the “Lock” setting to keep them linked. These are useful to horizontally center the FTT graph.
- Freq zoom
- Turn the frequency to the satellite you are expecting to see and use the slider to zoom in, it will make it easier to spot the pattern.
- Color and colormap
- Whatever color combination you fancy.
FFT Settings
I think these are only display options so nothing here will change the quality of the recording but it might make it easier to detect the signal when the satellite is overhead.
Now, wait for the satellite to appear at the horizon. Hit the “Rec” button as soon as you see the pattern appearing in the waterfall section. The pattern should get clearer the higher the satellite rises above the horizon. Manually change the width of the filter so it’s slightly larger than the striped pattern in the waterfall section. The frequency will not be exactly right, it’s a cheap dongle, so you might want to adjust the red frequency line in the panadapter to match the center peak. You might have to do this a few more times since the Doppler effect will cause the peaks to drift. This is not needed if the filter is wide enough though. Don’t stop the recording until the satellite is back behind the horizon and the pattern is gone.
Don’t forget to enjoy the therapeutic beeping sound send to you from 800 km away from space!
Decoding
Time for the big reveal. Install noaa-apt and feed it the recording you made earlier. Click decode. Switch to the processing tab and click process. Did it work? If not, don’t worry, it took me a 3 or 4 tries to get something recognizable. Tweak some parameters and try again on the next pass.
The images will always be greyscale without country contours. The colored ones with contours you see online are colored in by software. The country lines can be added by noaa-apt as well but for coloring, you’ll need WXtoImg.
We downloaded a live image from space, with €30 hardware, from a satellite launched 22 years ago flying at 30.000 km/hour that draws less power than your toaster. Who said 2020 can't be awesome?